MCP Power Tool mcp_matplot - Add High Quality 2D/3D Plotting to A Small Context LocalLLM.
We show you how you can get *very* powerful plotting capability to your local LLM!

How can you get amazing plotting capabilities out of a small LLM? Easy. Don't ask for the information back. What does that mean? We simply mute the json return, redirecting it to nice png graphs in a subdirectory, just not back to your LLM. It never sees the massive dataset that will kill most LLM contexts. By doing it this way we let the MCP agent simply generate a viewing point /history and have robust calling capability!
This MCP is now easily pulled and run as a standalone docker container!
docker pull cnmcdee/mcp_matplot:latest
docker run -d \
  --name mcp_matplot \
  -p 0.0.0.0:5016:5016 \
  -v "$(pwd)/plots:/app/plots" \
  --restart unless-stopped \
cnmcdee/mcp_matplot:latestLet's get started!
- We are going to build a highly robust docker that has a lot of parts like scipy, numpy, matplotlib
- It must also be a very forgiving MCP Agent. Just like humans - different LLM's may decide to make the tool calls in different ways. To accomodate this we tried to make each tool end-point absolutely as accomodating as possible.
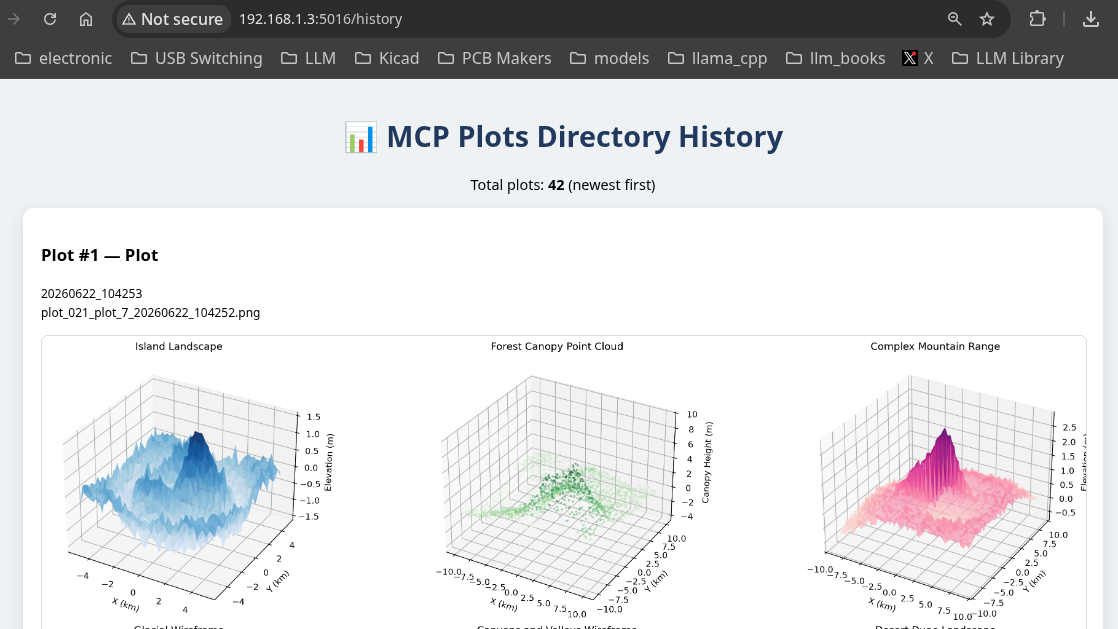
Secondly we need straight-pipe return html end-points so we defined /history as a viewing endpoint for seeing whatever your LLM's are drawing. You coverse with your LLM in your typical llama.cpp box and view the output at another box. For instance,
The code template is a specialized type of mcp namely:
@mcp.custom_route("/html", methods=["GET"]) , anyways..
Adding it to your llama.cpp is pretty easy. MCP Add Server.. click.
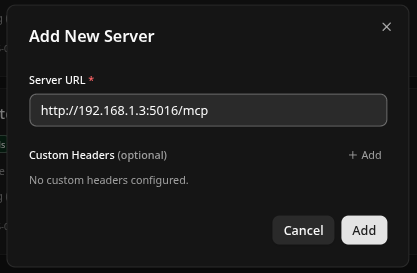
Then you will see in your list as:

- Finally we want it to just pass straight-shot
matplotlibor similar code directly to the MCP agent, have it run the code and generate the output. This is the only really good way to get it to make large-detail custom graphing without taking out your small contexts. - Yep we added some small
cleaning toolsthat will allow you to clean out the production directory.. - It should be understood that the matplotlib library functions can accept varying sized arrays. So in many cases just passing the code will be the best way, it runs it / plots it. If you try passing raw stuff - you will run out of context very easily.
How do you use it? That's easy - just ask the LLM to use it! Remember all the large graphs and numbers go to the directory they are never returned to the LLM to overflow small contexts. This is by design..
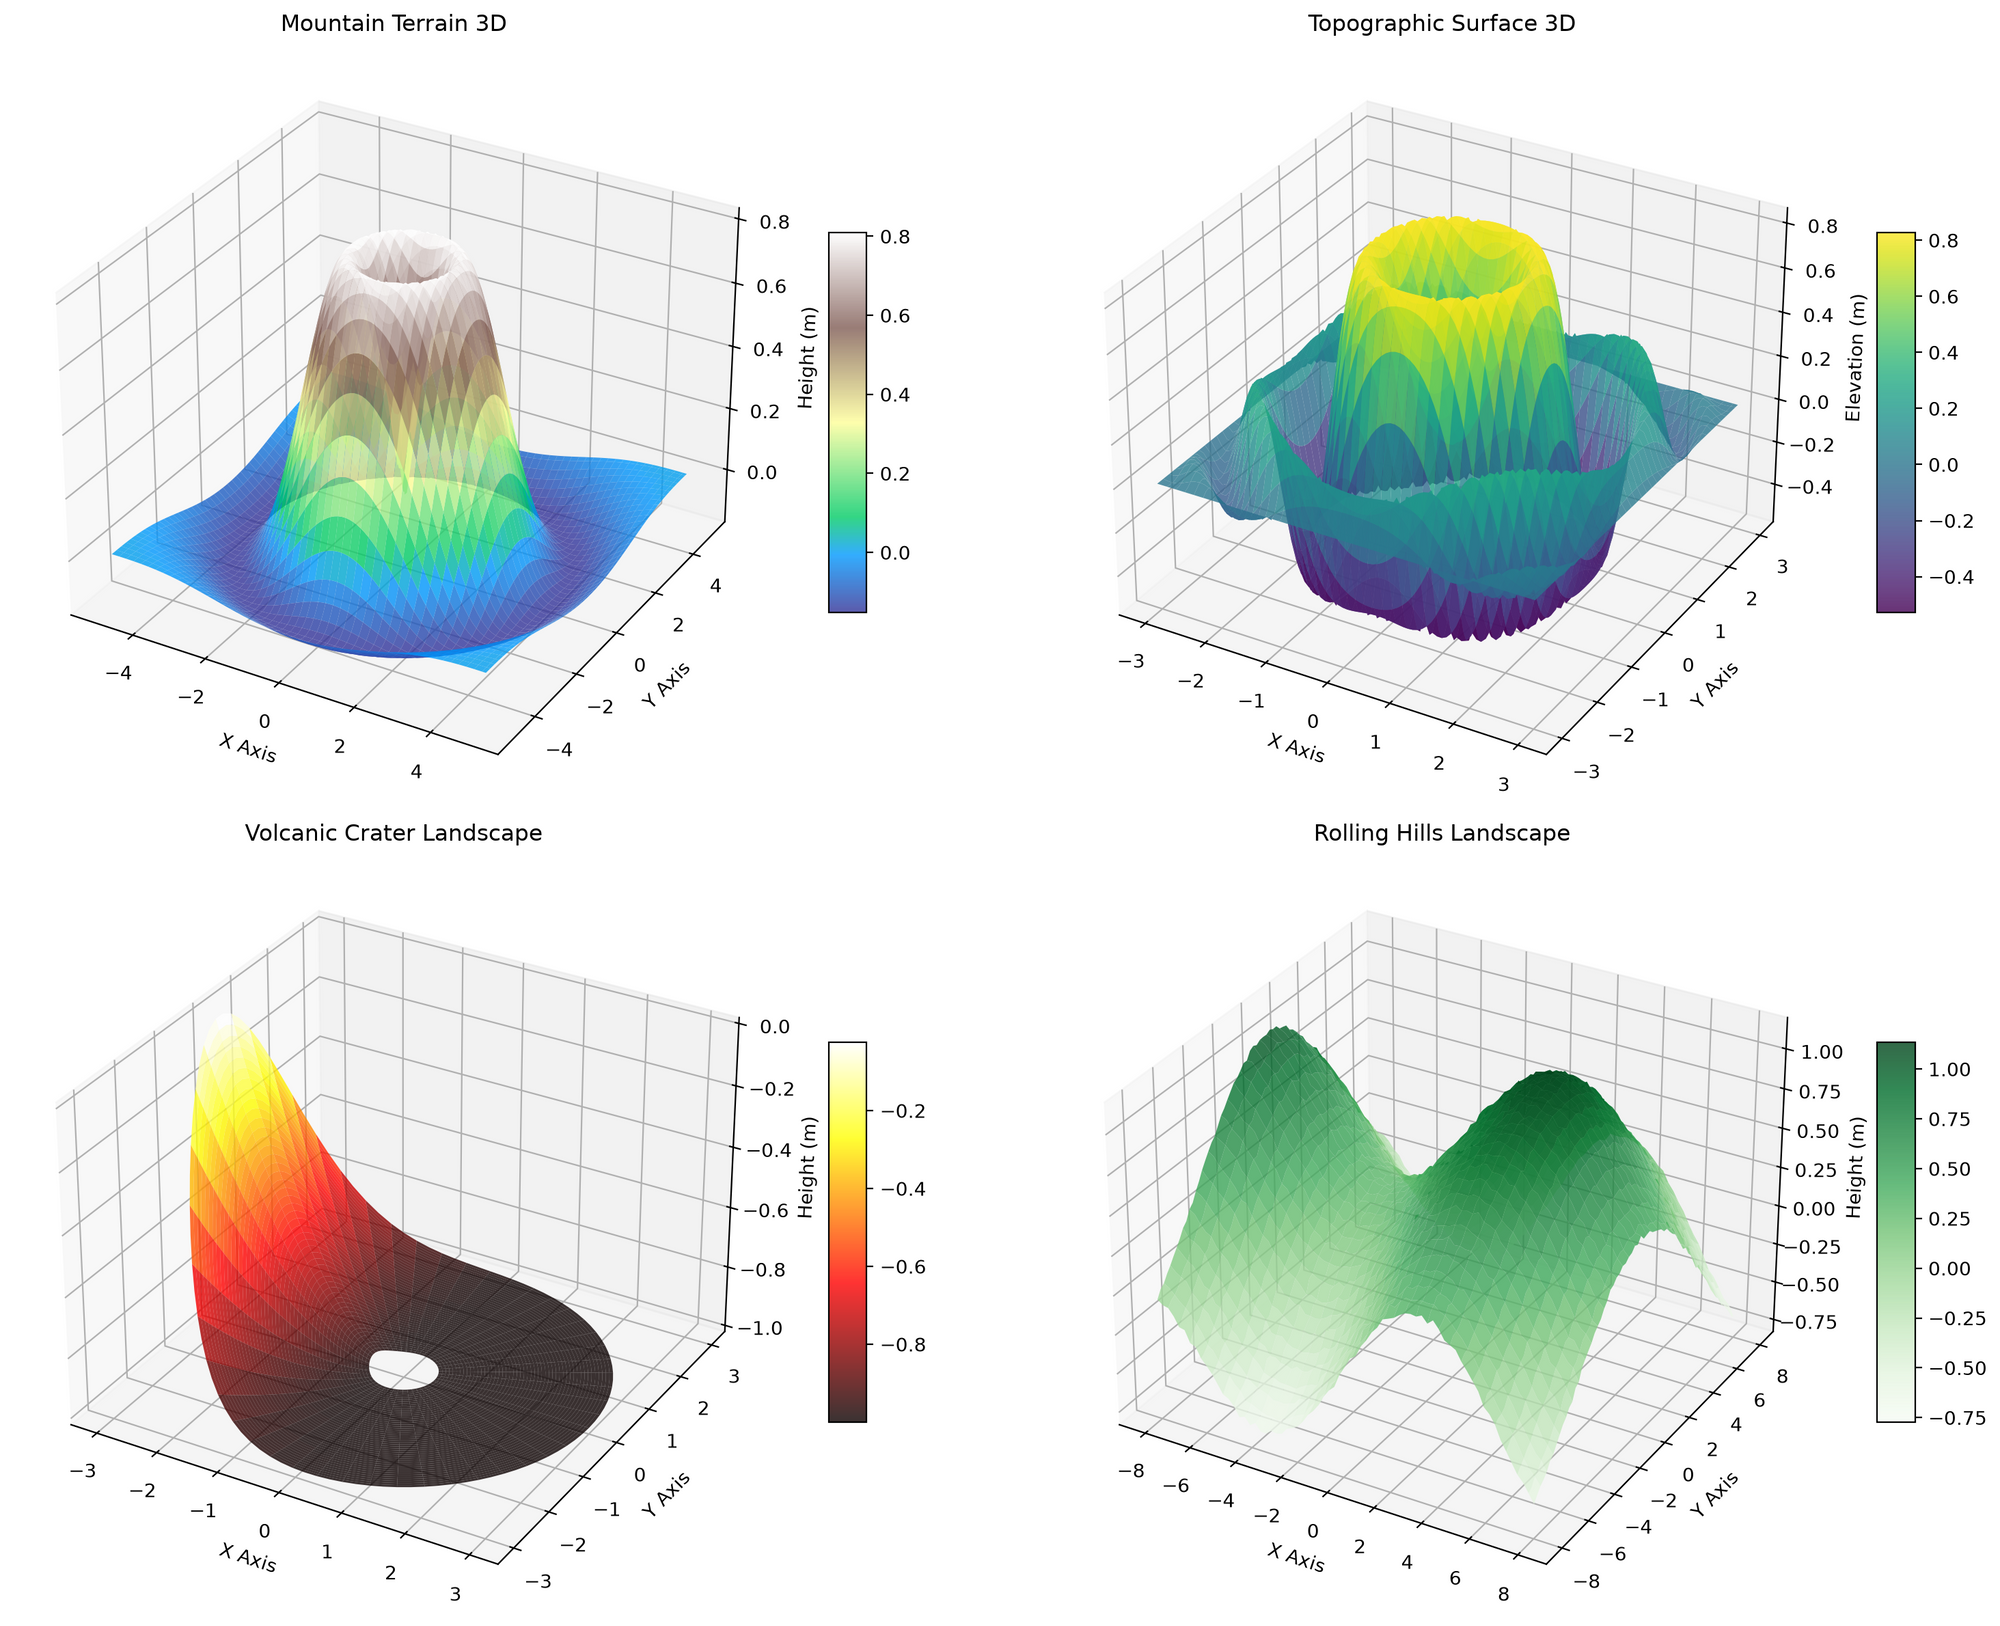
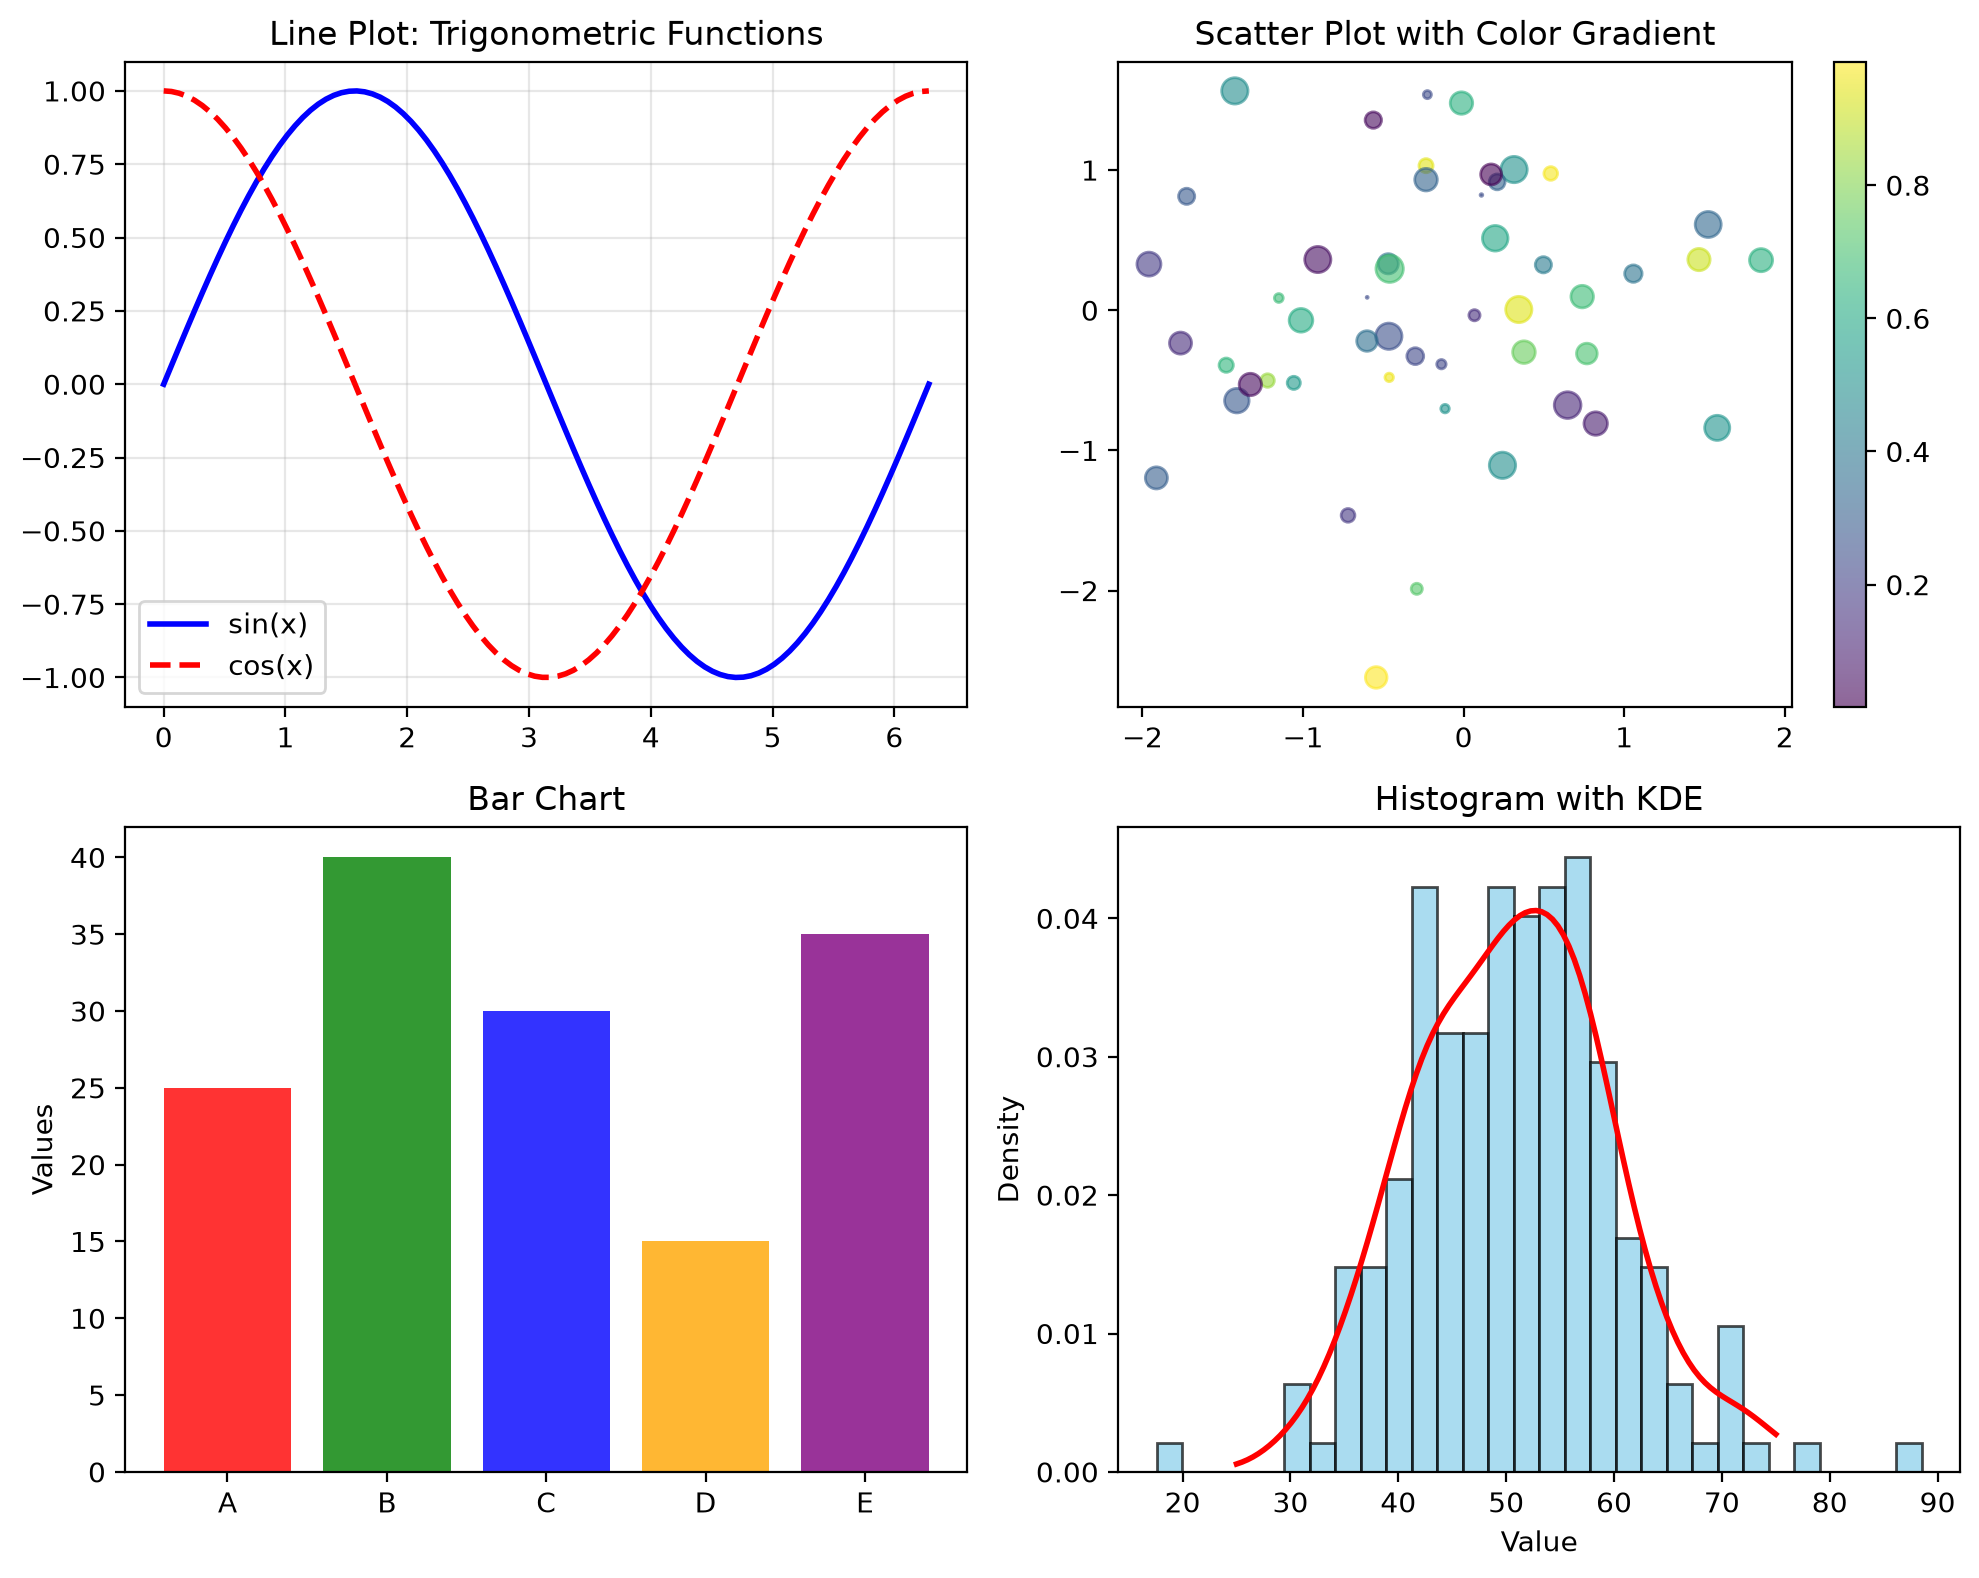
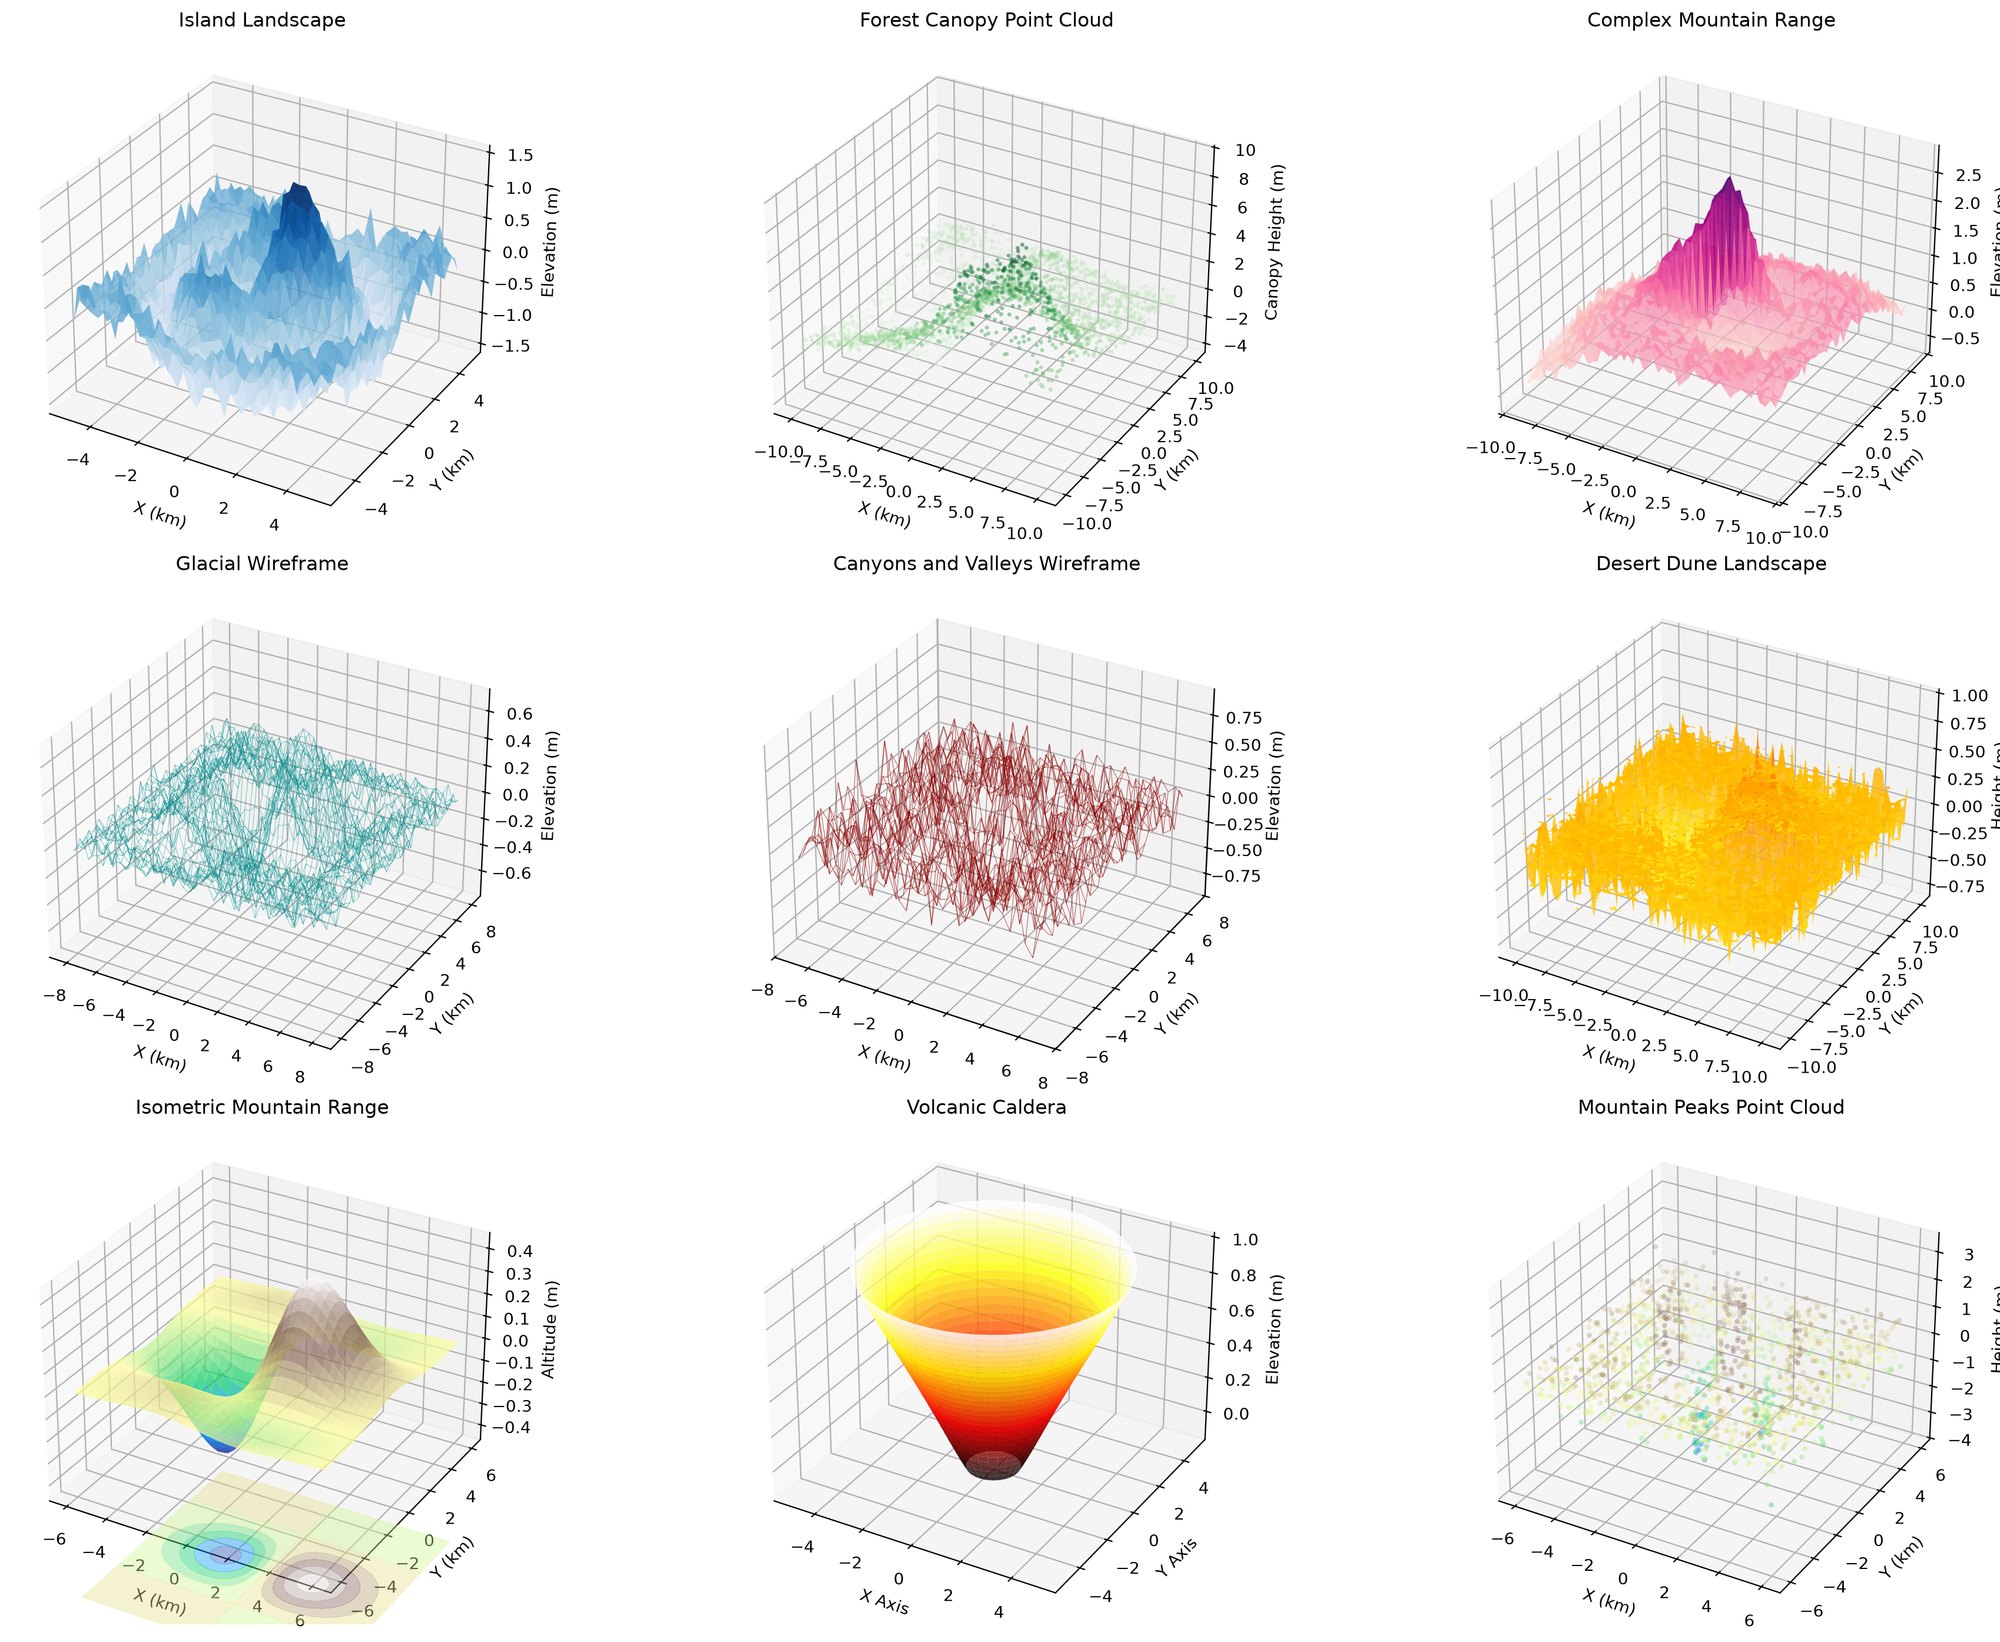
Test the execute_matplot_lib code with some beautiful 3d plots that show landscapesIn the end this is the code, a little messy but if you work through it you can add to it as you see fit, naturally cutting and pasting portions of it into any LLM that will happily write the rest for you!
#region import directives
from fastmcp import FastMCP
from starlette.middleware import Middleware
from starlette.middleware.cors import CORSMiddleware
from starlette.responses import HTMLResponse
import uvicorn
import json
import matplotlib
import matplotlib.pyplot as plot
import io
import base64
import os
from datetime import datetime
import matplotlib.pyplot as plot
import io
import base64
import json
import os
from pathlib import Path
from datetime import datetime
import base64
from pathlib import Path
import json
import base64
import io
import traceback
from typing import List, Optional, Union, Dict, Any
import matplotlib.pyplot as plt
import subprocess, sys # Ensure it's imported at module level
#endregion
#region Settings and Dependencies
PLOTS_DIR = Path("plots") # Make sure it's a Path object
PLOTS_DIR.mkdir(parents=True, exist_ok=True)
active_port = 5016
# Use non-interactive backend
matplotlib.use('Agg')
mcp = FastMCP(name="Matplotlib MCP Tool")
# Global list to track plots in the order they were created
plot_history = []
# Ensure plots directory exists
os.makedirs(PLOTS_DIR, exist_ok=True)
def ensure_dependencies():
"""Install a broad scientific Python stack to support 95%+ of LLM scientist calls."""
required_packages = [
"numpy", "pandas", "matplotlib", "scipy",
"seaborn", "scikit-learn", "statsmodels",
"plotly", "kaleido", # plotly static image export
"sympy", # symbolic math / equations
"pillow", # image handling
]
missing = []
for pkg in required_packages:
try:
__import__(pkg.replace("-", "_").split(".")[0]) # handle names like scikit-learn
except ImportError:
missing.append(pkg)
if missing:
print(f"Installing scientific dependencies: {missing}")
try:
# Use --no-input to avoid interactive prompts
subprocess.check_call([
sys.executable, "-m", "pip", "install", "--quiet", "--no-input", "--upgrade"
] + missing)
print("✅ Scientific dependencies installed successfully.")
except subprocess.CalledProcessError as e:
print(f"⚠️ Partial installation failure: {e}. Some advanced features may be limited.")
except Exception as e:
print(f"⚠️ Failed to auto-install packages: {e}")
else:
print("✅ All core scientific packages already available.")
return True
# Run once when module loads
ensure_dependencies()
def save_plot_to_file(fig, plot_type="plot"):
"""Save plot to plots directory and return filename."""
global plot_history
timestamp = datetime.now().strftime("%Y%m%d_%H%M%S")
counter = len(plot_history) + 1
filename = f"plots/plot_{counter:03d}_{plot_type}_{timestamp}.png"
fig.savefig(filename, bbox_inches='tight', dpi=200)
plot_history.append({
"filename": filename,
"plot_type": plot_type,
"timestamp": timestamp,
"number": counter
})
return filename
#endregion
#region plot_2dplot
@mcp.tool()
def plot_2dplot(
x: Union[List[float], List[int], Dict[str, Any], str, None] = None,
y: Union[List[float], List[int], Dict[str, Any], str, None] = None,
title: str = "Plot",
xlabel: str = "X",
ylabel: str = "Y",
color: str = "blue"
) -> str:
"""
Create a line plot. Very tolerant of different LLM calling styles.
"""
try:
# === Aggressive parameter extraction for LLM flexibility ===
params: Dict[str, Any] = {}
# Try to detect if any argument is a dict or JSON string
candidates = [x, y, title, xlabel, ylabel, color]
for candidate in candidates:
if isinstance(candidate, dict):
params = candidate
break
elif isinstance(candidate, str) and candidate.strip().startswith("{"):
try:
params = json.loads(candidate)
break
except Exception:
continue
# If we still have a dict in 'x', use it
if isinstance(x, dict):
params = x
# Extract all possible values
x = params.get('x', x)
y = params.get('y', y)
title = params.get('title', title)
xlabel = params.get('xlabel', xlabel)
ylabel = params.get('ylabel', ylabel)
color = params.get('color', color)
# Extra safety: try parsing string values that look like lists
if isinstance(x, str) and x.startswith('['):
try:
x = json.loads(x)
except Exception:
pass
if isinstance(y, str) and y.startswith('['):
try:
y = json.loads(y)
except Exception:
pass
# Convert numpy/pandas objects
if hasattr(x, 'tolist'):
x = x.tolist()
if hasattr(y, 'tolist'):
y = y.tolist()
# Final validation
if x is None or y is None:
return json.dumps({
"success": False,
"message": "Both 'x' and 'y' are required.",
"error": "Missing x or y data",
"received_params": {"x": str(type(x)), "y": str(type(y))}
}, indent=2)
if not isinstance(x, (list, tuple)) or not isinstance(y, (list, tuple)):
return json.dumps({
"success": False,
"message": "x and y must be lists of numbers.",
"error": f"Invalid types: x={type(x)}, y={type(y)}"
}, indent=2)
if len(x) != len(y):
return json.dumps({
"success": False,
"message": "x and y must have the same length.",
"error": f"Length mismatch: x={len(x)}, y={len(y)}"
}, indent=2)
# === Create the plot ===
fig = plot.figure(figsize=(10, 6))
plot.plot(x, y, color=color)
plot.title(title)
plot.xlabel(xlabel)
plot.ylabel(ylabel)
plot.grid(True)
filename = save_plot_to_file(fig, "line")
buf = io.BytesIO()
fig.savefig(buf, format='png', bbox_inches='tight')
buf.seek(0)
img_base64 = base64.b64encode(buf.read()).decode('utf-8')
plot.close(fig)
return json.dumps({
"success": True,
"message": "Line plot created and saved successfully.",
"plot_type": "line",
"image": img_base64,
"filename": filename,
"plot_number": len(plot_history) if 'plot_history' in globals() else 0,
"error": None
}, indent=2)
except Exception as e:
return json.dumps({
"success": False,
"message": "Failed to create line plot.",
"error": str(e),
"traceback": traceback.format_exc()
}, indent=2)
#endregion
#region plot_2dscatter
@mcp.tool()
def plot_2dscatter(
x: Union[List[float], List[int], Dict[str, Any], str, None] = None,
y: Union[List[float], List[int], Dict[str, Any], str, None] = None,
title: str = "Scatter Plot",
xlabel: str = "X",
ylabel: str = "Y",
color: str = "blue",
size: float = 50,
alpha: float = 0.7
) -> str:
"""
Create a scatter plot using matplotlib. Highly tolerant of different LLM calling styles.
"""
try:
# === Aggressive parameter extraction for LLM flexibility ===
params: Dict[str, Any] = {}
# Try to detect if any argument is a dict or JSON string
candidates = [x, y, title, xlabel, ylabel, color]
for candidate in candidates:
if isinstance(candidate, dict):
params = candidate
break
elif isinstance(candidate, str) and candidate.strip().startswith("{"):
try:
params = json.loads(candidate)
break
except Exception:
continue
# If first argument is a dict, use it
if isinstance(x, dict):
params = x
# Extract all possible values
x = params.get('x', x)
y = params.get('y', y)
title = params.get('title', title)
xlabel = params.get('xlabel', xlabel)
ylabel = params.get('ylabel', ylabel)
color = params.get('color', color)
size = params.get('size', size)
alpha = params.get('alpha', alpha)
# Extra safety: try parsing string values that look like lists
if isinstance(x, str) and x.startswith('['):
try:
x = json.loads(x)
except Exception:
pass
if isinstance(y, str) and y.startswith('['):
try:
y = json.loads(y)
except Exception:
pass
# Convert numpy/pandas objects
if hasattr(x, 'tolist'):
x = x.tolist()
if hasattr(y, 'tolist'):
y = y.tolist()
# Final validation
if x is None or y is None:
return json.dumps({
"success": False,
"message": "Both 'x' and 'y' are required.",
"error": "Missing x or y data",
"received_params": {"x": str(type(x)), "y": str(type(y))}
}, indent=2)
if not isinstance(x, (list, tuple)) or not isinstance(y, (list, tuple)):
return json.dumps({
"success": False,
"message": "x and y must be lists of numbers.",
"error": f"Invalid types: x={type(x)}, y={type(y)}"
}, indent=2)
if len(x) != len(y):
return json.dumps({
"success": False,
"message": "x and y must have the same length.",
"error": f"Length mismatch: x={len(x)}, y={len(y)}"
}, indent=2)
# === Create the scatter plot ===
fig = plot.figure(figsize=(10, 6))
plot.scatter(x, y, color=color, s=size, alpha=alpha)
plot.title(title)
plot.xlabel(xlabel)
plot.ylabel(ylabel)
plot.grid(True)
filename = save_plot_to_file(fig, "scatter")
buf = io.BytesIO()
fig.savefig(buf, format='png', bbox_inches='tight')
buf.seek(0)
img_base64 = base64.b64encode(buf.read()).decode('utf-8')
plot.close(fig)
return json.dumps({
"success": True,
"message": "Scatter plot created and saved successfully.",
"plot_type": "scatter",
"image": img_base64,
"filename": filename,
"plot_number": len(plot_history) if 'plot_history' in globals() else 0,
"error": None
}, indent=2)
except Exception as e:
return json.dumps({
"success": False,
"message": "Failed to create scatter plot.",
"error": str(e),
"traceback": traceback.format_exc()
}, indent=2)
#endregion
#region plot_2dbar
@mcp.tool()
def plot_2dbar(
x: Union[List[float], List[int], List[str], Dict[str, Any], str, None] = None,
y: Union[List[float], List[int], Dict[str, Any], str, None] = None,
title: str = "Bar Plot",
xlabel: str = "Categories",
ylabel: str = "Values",
color: str = "blue",
alpha: float = 0.8
) -> str:
"""
Create a bar plot using matplotlib. Highly tolerant of different LLM calling styles.
"""
try:
# === Aggressive parameter extraction for LLM flexibility ===
params: Dict[str, Any] = {}
# Try to detect if any argument is a dict or JSON string
candidates = [x, y, title, xlabel, ylabel, color]
for candidate in candidates:
if isinstance(candidate, dict):
params = candidate
break
elif isinstance(candidate, str) and candidate.strip().startswith("{"):
try:
params = json.loads(candidate)
break
except Exception:
continue
# If first argument is a dict, use it
if isinstance(x, dict):
params = x
# Extract all possible values
x = params.get('x', x)
y = params.get('y', y)
title = params.get('title', title)
xlabel = params.get('xlabel', xlabel)
ylabel = params.get('ylabel', ylabel)
color = params.get('color', color)
alpha = params.get('alpha', alpha)
# Extra safety: try parsing string values that look like lists
if isinstance(x, str) and (x.startswith('[') or x.startswith('{')):
try:
x = json.loads(x)
except Exception:
pass
if isinstance(y, str) and (y.startswith('[') or y.startswith('{')):
try:
y = json.loads(y)
except Exception:
pass
# Convert numpy/pandas objects
if hasattr(x, 'tolist'):
x = x.tolist()
if hasattr(y, 'tolist'):
y = y.tolist()
# Final validation
if x is None or y is None:
return json.dumps({
"success": False,
"message": "Both 'x' and 'y' are required.",
"error": "Missing x or y data",
"received_params": {"x": str(type(x)), "y": str(type(y))}
}, indent=2)
if not isinstance(x, (list, tuple)) or not isinstance(y, (list, tuple)):
return json.dumps({
"success": False,
"message": "x and y must be lists.",
"error": f"Invalid types: x={type(x)}, y={type(y)}"
}, indent=2)
if len(x) != len(y):
return json.dumps({
"success": False,
"message": "x and y must have the same length.",
"error": f"Length mismatch: x={len(x)}, y={len(y)}"
}, indent=2)
# === Create the bar plot ===
fig = plot.figure(figsize=(10, 6))
plot.bar(x, y, color=color, alpha=alpha)
plot.title(title)
plot.xlabel(xlabel)
plot.ylabel(ylabel)
plot.grid(True, axis='y')
# Rotate x labels if they are strings (categories)
if any(isinstance(label, str) for label in x):
plot.xticks(rotation=45, ha='right')
filename = save_plot_to_file(fig, "bar")
buf = io.BytesIO()
fig.savefig(buf, format='png', bbox_inches='tight')
buf.seek(0)
img_base64 = base64.b64encode(buf.read()).decode('utf-8')
plot.close(fig)
return json.dumps({
"success": True,
"message": "Bar plot created and saved successfully.",
"plot_type": "bar",
"image": img_base64,
"filename": filename,
"plot_number": len(plot_history) if 'plot_history' in globals() else 0,
"error": None
}, indent=2)
except Exception as e:
return json.dumps({
"success": False,
"message": "Failed to create bar plot.",
"error": str(e),
"traceback": traceback.format_exc()
}, indent=2)
#endregion
#region plot_2dbarh
@mcp.tool()
def plot_2dbarh(
x: Union[List[float], List[int], List[str], Dict[str, Any], str, None] = None,
y: Union[List[float], List[int], Dict[str, Any], str, None] = None,
title: str = "Horizontal Bar Plot",
xlabel: str = "Values",
ylabel: str = "Categories",
color: str = "blue",
alpha: float = 0.8
) -> str:
"""
Create a horizontal bar plot using matplotlib. Highly tolerant of different LLM calling styles.
"""
try:
# === Aggressive parameter extraction for LLM flexibility ===
params: Dict[str, Any] = {}
# Try to detect if any argument is a dict or JSON string
candidates = [x, y, title, xlabel, ylabel, color]
for candidate in candidates:
if isinstance(candidate, dict):
params = candidate
break
elif isinstance(candidate, str) and candidate.strip().startswith("{"):
try:
params = json.loads(candidate)
break
except Exception:
continue
# If first argument is a dict, use it
if isinstance(x, dict):
params = x
# Extract all possible values
x = params.get('x', x)
y = params.get('y', y)
title = params.get('title', title)
xlabel = params.get('xlabel', xlabel)
ylabel = params.get('ylabel', ylabel)
color = params.get('color', color)
alpha = params.get('alpha', alpha)
# Extra safety: try parsing string values that look like lists
if isinstance(x, str) and (x.startswith('[') or x.startswith('{')):
try:
x = json.loads(x)
except Exception:
pass
if isinstance(y, str) and (y.startswith('[') or y.startswith('{')):
try:
y = json.loads(y)
except Exception:
pass
# Convert numpy/pandas objects
if hasattr(x, 'tolist'):
x = x.tolist()
if hasattr(y, 'tolist'):
y = y.tolist()
# Final validation
if x is None or y is None:
return json.dumps({
"success": False,
"message": "Both 'x' and 'y' are required.",
"error": "Missing x or y data",
"received_params": {"x": str(type(x)), "y": str(type(y))}
}, indent=2)
if not isinstance(x, (list, tuple)) or not isinstance(y, (list, tuple)):
return json.dumps({
"success": False,
"message": "x and y must be lists.",
"error": f"Invalid types: x={type(x)}, y={type(y)}"
}, indent=2)
if len(x) != len(y):
return json.dumps({
"success": False,
"message": "x and y must have the same length.",
"error": f"Length mismatch: x={len(x)}, y={len(y)}"
}, indent=2)
# === Create the horizontal bar plot ===
fig = plot.figure(figsize=(10, 6))
# For horizontal bars, we typically swap x and y roles
# y = categories (on vertical axis), x = values (on horizontal axis)
plot.barh(y, x, color=color, alpha=alpha) # Note: barh(y, width=x)
plot.title(title)
plot.xlabel(xlabel)
plot.ylabel(ylabel)
plot.grid(True, axis='x')
# Rotate y labels if they are long strings
if any(isinstance(label, str) for label in y):
plot.yticks(rotation=0) # Usually no need to rotate for horizontal
filename = save_plot_to_file(fig, "barh")
buf = io.BytesIO()
fig.savefig(buf, format='png', bbox_inches='tight')
buf.seek(0)
img_base64 = base64.b64encode(buf.read()).decode('utf-8')
plot.close(fig)
return json.dumps({
"success": True,
"message": "Horizontal bar plot created and saved successfully.",
"plot_type": "barh",
"image": img_base64,
"filename": filename,
"plot_number": len(plot_history) if 'plot_history' in globals() else 0,
"error": None
}, indent=2)
except Exception as e:
return json.dumps({
"success": False,
"message": "Failed to create horizontal bar plot.",
"error": str(e),
"traceback": traceback.format_exc()
}, indent=2)
#endregion
#region plot_2dhist
@mcp.tool()
def plot_2dhist(
data: Union[List[float], List[int], Dict[str, Any], str, None] = None,
title: str = "Histogram",
xlabel: str = "Value",
ylabel: str = "Frequency",
color: str = "blue",
bins: int = 10,
alpha: float = 0.7
) -> str:
"""
Create a histogram using matplotlib. Highly tolerant of different LLM calling styles.
"""
try:
# === Aggressive parameter extraction for LLM flexibility ===
params: Dict[str, Any] = {}
candidates = [data, title, xlabel, ylabel, color]
for candidate in candidates:
if isinstance(candidate, dict):
params = candidate
break
elif isinstance(candidate, str) and candidate.strip().startswith("{"):
try:
params = json.loads(candidate)
break
except Exception:
continue
if isinstance(data, dict):
params = data
# Extract values
data = params.get('data', data)
title = params.get('title', title)
xlabel = params.get('xlabel', xlabel)
ylabel = params.get('ylabel', ylabel)
color = params.get('color', color)
bins = params.get('bins', bins)
alpha = params.get('alpha', alpha)
# Parse stringified lists
if isinstance(data, str) and (data.startswith('[') or data.startswith('{')):
try:
data = json.loads(data)
except Exception:
pass
# Convert numpy/pandas
if hasattr(data, 'tolist'):
data = data.tolist()
# Validation
if data is None:
return json.dumps({
"success": False,
"message": "'data' is required for histogram.",
"error": "Missing data",
"received_params": {"data": str(type(data))}
}, indent=2)
if not isinstance(data, (list, tuple)):
return json.dumps({
"success": False,
"message": "data must be a list of numbers.",
"error": f"Invalid type: data={type(data)}"
}, indent=2)
# === Create histogram ===
fig = plot.figure(figsize=(10, 6))
plot.hist(data, bins=bins, color=color, alpha=alpha)
plot.title(title)
plot.xlabel(xlabel)
plot.ylabel(ylabel)
plot.grid(True, axis='y')
filename = save_plot_to_file(fig, "hist")
buf = io.BytesIO()
fig.savefig(buf, format='png', bbox_inches='tight')
buf.seek(0)
img_base64 = base64.b64encode(buf.read()).decode('utf-8')
plot.close(fig)
return json.dumps({
"success": True,
"message": "Histogram created and saved successfully.",
"plot_type": "hist",
"image": img_base64,
"filename": filename,
"plot_number": len(plot_history) if 'plot_history' in globals() else 0,
"error": None
}, indent=2)
except Exception as e:
return json.dumps({
"success": False,
"message": "Failed to create histogram.",
"error": str(e),
"traceback": traceback.format_exc()
}, indent=2)
#endregion
#region plot_2dpie
@mcp.tool()
def plot_2dpie(
values: Union[List[float], List[int], Dict[str, Any], str, None] = None,
labels: Union[List[str], Dict[str, Any], str, None] = None,
title: str = "Pie Chart",
colors: Union[List[str], None] = None
) -> str:
"""
Create a pie chart using matplotlib. Highly tolerant of different LLM calling styles.
"""
try:
params: Dict[str, Any] = {}
candidates = [values, labels, title, colors]
for candidate in candidates:
if isinstance(candidate, dict):
params = candidate
break
elif isinstance(candidate, str) and candidate.strip().startswith("{"):
try:
params = json.loads(candidate)
break
except Exception:
continue
if isinstance(values, dict):
params = values
values = params.get('values', values)
labels = params.get('labels', labels)
title = params.get('title', title)
colors = params.get('colors', colors)
if isinstance(values, str) and values.startswith('['):
try:
values = json.loads(values)
except Exception:
pass
if isinstance(labels, str) and labels.startswith('['):
try:
labels = json.loads(labels)
except Exception:
pass
if hasattr(values, 'tolist'):
values = values.tolist()
if values is None:
return json.dumps({
"success": False,
"message": "'values' is required for pie chart.",
"error": "Missing values"
}, indent=2)
if not isinstance(values, (list, tuple)):
return json.dumps({
"success": False,
"message": "values must be a list of numbers.",
"error": f"Invalid type: values={type(values)}"
}, indent=2)
# === Create pie chart ===
fig = plot.figure(figsize=(10, 6))
plot.pie(values, labels=labels, colors=colors, autopct='%1.1f%%', startangle=90)
plot.title(title)
plot.axis('equal')
filename = save_plot_to_file(fig, "pie")
buf = io.BytesIO()
fig.savefig(buf, format='png', bbox_inches='tight')
buf.seek(0)
img_base64 = base64.b64encode(buf.read()).decode('utf-8')
plot.close(fig)
return json.dumps({
"success": True,
"message": "Pie chart created and saved successfully.",
"plot_type": "pie",
"image": img_base64,
"filename": filename,
"plot_number": len(plot_history) if 'plot_history' in globals() else 0,
"error": None
}, indent=2)
except Exception as e:
return json.dumps({
"success": False,
"message": "Failed to create pie chart.",
"error": str(e),
"traceback": traceback.format_exc()
}, indent=2)
#endregion
#region plot_2dboxplot
@mcp.tool()
def plot_2dboxplot(
data: Union[List[float], List[int], Dict[str, Any], str, None] = None,
title: str = "Box Plot",
xlabel: str = "Category",
ylabel: str = "Value",
color: str = "lightblue"
) -> str:
"""
Create a box plot using matplotlib. Highly tolerant of different LLM calling styles.
"""
try:
params: Dict[str, Any] = {}
candidates = [data, title, xlabel, ylabel, color]
for candidate in candidates:
if isinstance(candidate, dict):
params = candidate
break
elif isinstance(candidate, str) and candidate.strip().startswith("{"):
try:
params = json.loads(candidate)
break
except Exception:
continue
if isinstance(data, dict):
params = data
data = params.get('data', data)
title = params.get('title', title)
xlabel = params.get('xlabel', xlabel)
ylabel = params.get('ylabel', ylabel)
color = params.get('color', color)
if isinstance(data, str) and data.startswith('['):
try:
data = json.loads(data)
except Exception:
pass
if hasattr(data, 'tolist'):
data = data.tolist()
if data is None:
return json.dumps({
"success": False,
"message": "'data' is required for boxplot.",
"error": "Missing data"
}, indent=2)
if not isinstance(data, (list, tuple)):
return json.dumps({
"success": False,
"message": "data must be a list.",
"error": f"Invalid type: data={type(data)}"
}, indent=2)
# === Create boxplot ===
fig = plot.figure(figsize=(10, 6))
plot.boxplot(data, patch_artist=True, boxprops=dict(facecolor=color))
plot.title(title)
plot.xlabel(xlabel)
plot.ylabel(ylabel)
plot.grid(True, axis='y')
filename = save_plot_to_file(fig, "boxplot")
buf = io.BytesIO()
fig.savefig(buf, format='png', bbox_inches='tight')
buf.seek(0)
img_base64 = base64.b64encode(buf.read()).decode('utf-8')
plot.close(fig)
return json.dumps({
"success": True,
"message": "Box plot created and saved successfully.",
"plot_type": "boxplot",
"image": img_base64,
"filename": filename,
"plot_number": len(plot_history) if 'plot_history' in globals() else 0,
"error": None
}, indent=2)
except Exception as e:
return json.dumps({
"success": False,
"message": "Failed to create box plot.",
"error": str(e),
"traceback": traceback.format_exc()
}, indent=2)
#endregion
#region plot_2dfill
@mcp.tool()
def plot_2dfill(
x: Union[List[float], List[int], Dict[str, Any], str, None] = None,
y: Union[List[float], List[int], Dict[str, Any], str, None] = None,
title: str = "Area Plot",
xlabel: str = "X",
ylabel: str = "Y",
color: str = "blue",
alpha: float = 0.5
) -> str:
"""
Create a filled area plot using matplotlib plot.fill().
Highly tolerant of different LLM calling styles.
"""
try:
# === Aggressive parameter extraction for LLM flexibility ===
params: Dict[str, Any] = {}
# Try to detect if any argument is a dict or JSON string
candidates = [x, y, title, xlabel, ylabel, color]
for candidate in candidates:
if isinstance(candidate, dict):
params = candidate
break
elif isinstance(candidate, str) and candidate.strip().startswith("{"):
try:
params = json.loads(candidate)
break
except Exception:
continue
# If first argument is a dict, use it
if isinstance(x, dict):
params = x
# Extract all possible values
x = params.get('x', x)
y = params.get('y', y)
title = params.get('title', title)
xlabel = params.get('xlabel', xlabel)
ylabel = params.get('ylabel', ylabel)
color = params.get('color', color)
alpha = params.get('alpha', alpha)
# Extra safety: try parsing string values that look like lists
if isinstance(x, str) and (x.startswith('[') or x.startswith('{')):
try:
x = json.loads(x)
except Exception:
pass
if isinstance(y, str) and (y.startswith('[') or y.startswith('{')):
try:
y = json.loads(y)
except Exception:
pass
# Convert numpy/pandas objects
if hasattr(x, 'tolist'):
x = x.tolist()
if hasattr(y, 'tolist'):
y = y.tolist()
# Final validation
if x is None or y is None:
return json.dumps({
"success": False,
"message": "Both 'x' and 'y' are required.",
"error": "Missing x or y data",
"received_params": {"x": str(type(x)), "y": str(type(y))}
}, indent=2)
if not isinstance(x, (list, tuple)) or not isinstance(y, (list, tuple)):
return json.dumps({
"success": False,
"message": "x and y must be lists of numbers.",
"error": f"Invalid types: x={type(x)}, y={type(y)}"
}, indent=2)
if len(x) != len(y):
return json.dumps({
"success": False,
"message": "x and y must have the same length.",
"error": f"Length mismatch: x={len(x)}, y={len(y)}"
}, indent=2)
# === Create the filled area plot ===
fig = plot.figure(figsize=(10, 6))
plot.fill(x, y, color=color, alpha=alpha)
plot.plot(x, y, color=color) # Add line on top of fill
plot.title(title)
plot.xlabel(xlabel)
plot.ylabel(ylabel)
plot.grid(True)
filename = save_plot_to_file(fig, "fill")
buf = io.BytesIO()
fig.savefig(buf, format='png', bbox_inches='tight')
buf.seek(0)
img_base64 = base64.b64encode(buf.read()).decode('utf-8')
plot.close(fig)
return json.dumps({
"success": True,
"message": "Area (fill) plot created and saved successfully.",
"plot_type": "fill",
"image": img_base64,
"filename": filename,
"plot_number": len(plot_history) if 'plot_history' in globals() else 0,
"error": None
}, indent=2)
except Exception as e:
return json.dumps({
"success": False,
"message": "Failed to create area plot.",
"error": str(e),
"traceback": traceback.format_exc()
}, indent=2)
#endregion
#region plot_2dviolinplot
@mcp.tool()
def plot_2dviolinplot(
data: Union[List[float], List[int], List[List[float]], Dict[str, Any], str, None] = None,
title: str = "Violin Plot",
xlabel: str = "Category",
ylabel: str = "Value",
color: str = "lightblue",
showmeans: bool = True,
showmedians: bool = True
) -> str:
"""
Create a violin plot using matplotlib. Highly tolerant of different LLM calling styles.
"""
try:
# === Aggressive parameter extraction for LLM flexibility ===
params: Dict[str, Any] = {}
# Try to detect if any argument is a dict or JSON string
candidates = [data, title, xlabel, ylabel, color]
for candidate in candidates:
if isinstance(candidate, dict):
params = candidate
break
elif isinstance(candidate, str) and candidate.strip().startswith("{"):
try:
params = json.loads(candidate)
break
except Exception:
continue
# If first argument is a dict, use it
if isinstance(data, dict):
params = data
# Extract all possible values
data = params.get('data', data)
title = params.get('title', title)
xlabel = params.get('xlabel', xlabel)
ylabel = params.get('ylabel', ylabel)
color = params.get('color', color)
showmeans = params.get('showmeans', showmeans)
showmedians = params.get('showmedians', showmedians)
# Extra safety: try parsing string values that look like lists
if isinstance(data, str) and (data.startswith('[') or data.startswith('{')):
try:
data = json.loads(data)
except Exception:
pass
# Convert numpy/pandas objects
if hasattr(data, 'tolist'):
data = data.tolist()
# Validation
if data is None:
return json.dumps({
"success": False,
"message": "'data' is required for violin plot.",
"error": "Missing data",
"received_params": {"data": str(type(data))}
}, indent=2)
# Ensure data is a list (can be list of lists for multiple violins)
if not isinstance(data, (list, tuple)):
return json.dumps({
"success": False,
"message": "data must be a list of numbers or list of lists.",
"error": f"Invalid type: data={type(data)}"
}, indent=2)
# === Create the violin plot ===
fig = plot.figure(figsize=(10, 6))
# Violin plot can accept list of arrays
violin_parts = plot.violinplot(data, showmeans=showmeans, showmedians=showmedians)
# Color the violins
for pc in violin_parts['bodies']:
pc.set_facecolor(color)
pc.set_edgecolor('black')
pc.set_alpha(0.7)
plot.title(title)
plot.xlabel(xlabel)
plot.ylabel(ylabel)
plot.grid(True, axis='y')
filename = save_plot_to_file(fig, "violin")
buf = io.BytesIO()
fig.savefig(buf, format='png', bbox_inches='tight')
buf.seek(0)
img_base64 = base64.b64encode(buf.read()).decode('utf-8')
plot.close(fig)
return json.dumps({
"success": True,
"message": "Violin plot created and saved successfully.",
"plot_type": "violin",
"image": img_base64,
"filename": filename,
"plot_number": len(plot_history) if 'plot_history' in globals() else 0,
"error": None
}, indent=2)
except Exception as e:
return json.dumps({
"success": False,
"message": "Failed to create violin plot.",
"error": str(e),
"traceback": traceback.format_exc()
}, indent=2)
#endregion
#region execute_matplotlib_code
@mcp.tool()
def execute_matplotlib_code(
code: str,
filename: str = None,
title: str = "Matplotlib Plot",
dpi: int = 150
) -> str:
"""
Robust matplotlib code executor using save_plot_to_file().
"""
try:
if not code or not isinstance(code, str):
raise ValueError("Code parameter is required.")
# Shared result container
exec_result = {"saved_files": [], "final_filename": None}
local_env: Dict[str, Any] = {
"plt": plt,
"os": os,
"save_plot_to_file": save_plot_to_file,
"exec_result": exec_result,
"__builtins__": __builtins__,
"PLOTS_DIR": PLOTS_DIR, # pass the Path object
}
enforced_code = f"""
import matplotlib.pyplot as plt
import os
from pathlib import Path
# User's code
{code}
saved_filenames = []
if plt.get_fignums():
for i, fig_num in enumerate(plt.get_fignums()):
fig = plt.figure(fig_num)
suffix = "plot" if i == 0 else f"plot_{{i}}"
fname = save_plot_to_file(fig, suffix)
saved_filenames.append(fname)
print(f"Saved plot: {{fname}}")
else:
fig = plt.figure(figsize=(10, 6))
plt.title('{title}')
plt.grid(True)
fname = save_plot_to_file(fig, "default")
saved_filenames.append(fname)
print(f"Saved default plot: {{fname}}")
exec_result["saved_files"] = saved_filenames
exec_result["final_filename"] = saved_filenames[-1] if saved_filenames else None
print("FINAL_FILENAME:" + (exec_result["final_filename"] or "unknown"))
"""
exec_globals = {"__builtins__": __builtins__}
exec(enforced_code, exec_globals, local_env)
final_filename = exec_result.get("final_filename") or "unknown_plot.png"
return json.dumps({
"success": True,
"message": "Matplotlib code executed successfully.",
"filename": final_filename,
"saved_files": exec_result.get("saved_files", []),
"full_path": str(PLOTS_DIR / final_filename),
"image": None,
"image_url": f"/plots/{final_filename}",
"error": None
}, indent=2)
except Exception as e:
return json.dumps({
"success": False,
"message": "Failed to execute matplotlib code.",
"error": str(e),
"traceback": traceback.format_exc()
}, indent=2)
#endregion
#endregion
#region plot_3dplot
@mcp.tool()
def plot_3d(
x: Union[List, Dict, str, None] = None,
y: Union[List, Dict, str, None] = None,
z: Union[List, Dict, str, None] = None,
title: str = "3D Plot",
xlabel: str = "X",
ylabel: str = "Y",
zlabel: str = "Z",
color: str = "blue",
plot_type: str = "scatter" # "scatter", "line", "surface"
) -> str:
"""
Robust 3D/2D plot tool. Handles parameters passed as:
- Individual arguments
- Single dictionary (common in tool calling)
- JSON-stringified values
- Mixed formats
"""
try:
# === 1. Aggressive parameter extraction ===
params: Dict[str, Any] = {}
# Check each argument for a dict or JSON dict string
candidates = [x, y, z, title, xlabel, ylabel, zlabel, color, plot_type]
for cand in candidates:
if isinstance(cand, dict):
params = cand
break
if isinstance(cand, str) and cand.strip().startswith(('{', '[')):
try:
parsed = json.loads(cand)
if isinstance(parsed, dict):
params = parsed
break
except Exception:
continue
# If x itself is a dict, treat it as the full params (very common pattern)
if isinstance(x, dict):
params = x
# === 2. Extract and override with params ===
def extract(key, default):
return params.get(key, default)
x = extract('x', x)
y = extract('y', y)
z = extract('z', z)
title = extract('title', title)
xlabel = extract('xlabel', xlabel)
ylabel = extract('ylabel', ylabel)
zlabel = extract('zlabel', zlabel)
color = extract('color', color)
plot_type = extract('plot_type', plot_type).lower().strip()
# === 3. Robust data normalization ===
def normalize_data(data: Any) -> List:
if data is None:
return None
if isinstance(data, str):
data = data.strip()
if data.startswith(('[', '{')):
try:
data = json.loads(data)
except Exception:
pass
# Convert numpy/pandas
if hasattr(data, 'tolist'):
data = data.tolist()
if isinstance(data, (list, tuple)):
# Handle list of dicts or deeply nested cases if needed
return [float(v) if isinstance(v, (int, float, str)) and str(v).replace('.', '', 1).isdigit() else v
for v in data]
return data
x = normalize_data(x)
y = normalize_data(y)
z = normalize_data(z)
# === 4. Auto-detect dimensionality ===
is_3d = z is not None and len([v for v in (x, y, z) if v is not None]) >= 3
# === 5. Create plot ===
fig = plot.figure(figsize=(12, 9))
ax = fig.add_subplot(111, projection='3d' if is_3d else None)
if is_3d:
if plot_type == "line":
ax.plot(x, y, z, color=color)
else: # default scatter
ax.scatter(x, y, z, color=color, s=50)
ax.set_zlabel(zlabel)
else:
# 2D fallback
if plot_type == "line":
ax.plot(x, y, color=color)
else:
ax.scatter(x, y, color=color)
ax.set_title(title)
ax.set_xlabel(xlabel)
ax.set_ylabel(ylabel)
ax.grid(True)
# Save to file (your existing helper)
filename = save_plot_to_file(fig, "3d" if is_3d else "2d")
# Base64 for immediate return
buf = io.BytesIO()
fig.savefig(buf, format='png', bbox_inches='tight', dpi=150)
buf.seek(0)
img_base64 = base64.b64encode(buf.read()).decode('utf-8')
plot.close(fig)
return json.dumps({
"success": True,
"message": f"{'3D' if is_3d else '2D'} {plot_type} plot created successfully.",
"plot_type": "3d_" + plot_type if is_3d else plot_type,
"is_3d": is_3d,
"image": img_base64,
"filename": filename,
"plot_number": len(globals().get('plot_history', [])),
"error": None
}, indent=2)
except Exception as e:
return json.dumps({
"success": False,
"message": "Failed to create 3D/2D plot.",
"error": str(e),
"traceback": traceback.format_exc()
}, indent=2)
#endregion
@mcp.tool()
def remove_active_plots():
"""
Remove all entries from plot_history and delete the corresponding image files.
"""
try:
deleted_files = 0
history_entries = 0
if 'plot_history' in globals() and plot_history:
history_entries = len(plot_history)
for plot in plot_history[:]: # copy to avoid modification during iteration
filename = plot.get("filename")
if filename:
file_path = PLOTS_DIR / filename
if file_path.exists():
file_path.unlink()
deleted_files += 1
plot_history.clear()
result = {
"success": True,
"message": f"Removed {history_entries} plot history entries and deleted {deleted_files} image files.",
"history_cleared": history_entries,
"files_deleted": deleted_files
}
else:
result = {
"success": True,
"message": "plot_history was empty or not available. No action taken.",
"history_cleared": 0,
"files_deleted": 0
}
return json.dumps(result, indent=2)
except Exception as e:
error_result = {
"success": False,
"message": f"Error while removing active plots: {str(e)}",
"history_cleared": 0,
"files_deleted": 0
}
return json.dumps(error_result, indent=2)
@mcp.tool()
def clean_plots_directory():
"""
Completely clean the plots directory by deleting all files inside it.
"""
try:
if not PLOTS_DIR.exists():
result = {
"success": False,
"message": f"Plots directory {PLOTS_DIR} does not exist.",
"files_deleted": 0
}
return json.dumps(result, indent=2)
files_before = [f for f in PLOTS_DIR.glob("*.*") if f.is_file()]
file_count = len(files_before)
if file_count == 0:
result = {
"success": True,
"message": "Plots directory is already empty.",
"files_deleted": 0
}
return json.dumps(result, indent=2)
# Delete all files
for file_path in files_before:
file_path.unlink()
# Clear history if it exists
if 'plot_history' in globals():
plot_history.clear()
result = {
"success": True,
"message": f"Successfully cleaned plots directory. Removed {file_count} files.",
"files_deleted": file_count
}
return json.dumps(result, indent=2)
except Exception as e:
error_result = {
"success": False,
"message": f"Error while cleaning plots directory: {str(e)}",
"files_deleted": 0
}
return json.dumps(error_result, indent=2)
@mcp.tool()
def get_plot_history():
"""Return history of all generated plots."""
try:
return json.dumps({
"success": True,
"total_plots": len(plot_history),
"history": plot_history,
"error": None
})
except Exception as e:
return json.dumps({
"success": False,
"error": str(e)
})
# ====================== Direct HTML for Browser ======================
@mcp.custom_route("/html", methods=["GET"])
async def serve_html(request):
"""Serves a clean HTML page directly to web browsers."""
html_content = """<!DOCTYPE html>
<html lang="en">
<head>
<meta charset="UTF-8">
<meta name="viewport" content="width=device-width, initial-scale=1.0">
<title>MCP Matplotlib Server</title>
<style>
body { font-family: system-ui, Arial, sans-serif; margin: 0; padding: 40px; background: #f0f2f5; }
.card { max-width: 900px; margin: 40px auto; background: white; padding: 40px; border-radius: 12px; box-shadow: 0 8px 25px rgba(0,0,0,0.1); }
</style>
</head>
<body>
<div class="card">
<h1>✅ MCP Matplotlib Server Ready</h1>
<p>Plots are automatically saved to the <strong>plots/</strong> folder in creation order.</p>
<p>Use <strong>get_plot_history</strong> tool to see all generated plots.</p>
</div>
</body>
</html>"""
return HTMLResponse(content=html_content)
@mcp.custom_route("/plots", methods=["GET"])
async def serve_plots_gallery(request):
"""Display all saved plots in a clean HTML gallery in the order they were created."""
try:
plots_html = ""
for plot in plot_history:
rel_path = plot["filename"]
plots_html += f"""
<div class="plot-card">
<h3>Plot #{plot['number']} — {plot['plot_type'].title()}</h3>
<p><small>{plot['timestamp']}</small></p>
<img src="{rel_path}" alt="{plot['plot_type']}" style="max-width:100%; border:1px solid #ddd; border-radius:8px;">
<hr>
</div>
"""
if not plot_history:
plots_html = "<p><em>No plots generated yet.</em></p>"
html_content = f"""<!DOCTYPE html>
<html lang="en">
<head>
<meta charset="UTF-8">
<meta name="viewport" content="width=device-width, initial-scale=1.0">
<title>MCP Plot Gallery</title>
<style>
body {{ font-family: system-ui, Arial, sans-serif; margin: 0; padding: 20px; background: #f0f2f5; }}
.container {{ max-width: 1200px; margin: 0 auto; }}
.plot-card {{ background: white; padding: 20px; margin-bottom: 30px; border-radius: 12px; box-shadow: 0 4px 15px rgba(0,0,0,0.1); }}
h1 {{ text-align: center; color: #1a365d; }}
img {{ display: block; margin: 15px auto; }}
</style>
</head>
<body>
<div class="container">
<h1>📊 MCP Generated Plots Gallery</h1>
<p style="text-align:center;">Total plots: <strong>{len(plot_history)}</strong> (in creation order)</p>
{plots_html}
</div>
</body>
</html>"""
return HTMLResponse(content=html_content)
except Exception as e:
error_html = f"""<!DOCTYPE html>
<html><body><h1>Error loading gallery</h1><p>{str(e)}</p></body></html>"""
return HTMLResponse(content=error_html)
@mcp.custom_route("/history", methods=["GET"])
async def serve_plots_history(request):
"""Scan the plots directory and generate self-contained HTML with embedded plots."""
try:
if not PLOTS_DIR.exists():
raise FileNotFoundError(f"Plots directory not found: {PLOTS_DIR}")
image_files = sorted(
list(PLOTS_DIR.glob("*.png")) + list(PLOTS_DIR.glob("*.jpg")) + list(PLOTS_DIR.glob("*.jpeg")),
key=lambda x: x.stat().st_ctime,
reverse=True
)
plots_html = ""
for idx, file_path in enumerate(image_files, 1):
filename = file_path.name
timestamp = datetime.fromtimestamp(file_path.stat().st_ctime).strftime("%Y%m%d_%H%M%S")
# Detect plot type
plot_type = "Plot"
name_lower = filename.lower()
if "line" in name_lower:
plot_type = "Line"
elif "bar" in name_lower:
plot_type = "Bar"
elif "pie" in name_lower:
plot_type = "Pie"
elif "scatter" in name_lower:
plot_type = "Scatter"
# Embed image as base64
with open(file_path, "rb") as f:
img_data = base64.b64encode(f.read()).decode("utf-8")
img_src = f"data:image/png;base64,{img_data}" # change to jpeg if needed
plots_html += f"""
<div class="plot-card">
<h3>Plot #{idx} — {plot_type}</h3>
<p><small>{timestamp}</small><br><small>{filename}</small></p>
<img src="{img_src}" alt="{plot_type}" style="max-width:100%; border:1px solid #ddd; border-radius:8px;">
<hr>
</div>
"""
if not image_files:
plots_html = "<p><em>No image files found in the directory.</em></p>"
html_content = f"""<!DOCTYPE html>
<html lang="en">
<head>
<meta charset="UTF-8">
<meta name="viewport" content="width=device-width, initial-scale=1.0">
<title>MCP Plots History</title>
<style>
body {{ font-family: system-ui, Arial, sans-serif; margin: 0; padding: 20px; background: #f0f2f5; }}
.container {{ max-width: 1200px; margin: 0 auto; }}
.plot-card {{ background: white; padding: 20px; margin-bottom: 30px; border-radius: 12px; box-shadow: 0 4px 15px rgba(0,0,0,0.1); }}
h1 {{ text-align: center; color: #1a365d; }}
img {{ display: block; margin: 15px auto; }}
</style>
</head>
<body>
<div class="container">
<h1>📊 MCP Plots Directory History</h1>
<p style="text-align:center;">Total plots: <strong>{len(image_files)}</strong> (newest first)</p>
{plots_html}
</div>
</body>
</html>"""
return HTMLResponse(content=html_content)
except Exception as e:
error_html = f"""<!DOCTYPE html>
<html><body><h1>Error loading history</h1><p>{str(e)}</p></body></html>"""
return HTMLResponse(content=error_html)
@mcp.custom_route("/test", methods=["GET"])
async def serve_plots_gallery(request):
"""Display all saved plots in a clean HTML gallery with embedded plots."""
try:
plots_html = ""
for plot in plot_history:
filename = plot["filename"]
file_path = Path(PLOTS_DIR) / filename # PLOTS_DIR must be defined
if file_path.exists():
# Read and embed as base64
with open(file_path, "rb") as f:
img_data = base64.b64encode(f.read()).decode("utf-8")
img_src = f"data:image/png;base64,{img_data}"
else:
img_src = "" # fallback
plots_html += f"""
<div class="plot-card">
<h3>Plot #{plot['number']} — {plot['plot_type'].title()}</h3>
<p><small>{plot['timestamp']}</small></p>
<img src="{img_src}" alt="{plot['plot_type']}" style="max-width:100%; border:1px solid #ddd; border-radius:8px;">
<hr>
</div>
"""
if not plot_history:
plots_html = "<p><em>No plots generated yet.</em></p>"
html_content = f"""<!DOCTYPE html>
<html lang="en">
<head>
<meta charset="UTF-8">
<meta name="viewport" content="width=device-width, initial-scale=1.0">
<title>MCP Plot Gallery</title>
<style>
body {{ font-family: system-ui, Arial, sans-serif; margin: 0; padding: 20px; background: #f0f2f5; }}
.container {{ max-width: 1200px; margin: 0 auto; }}
.plot-card {{ background: white; padding: 20px; margin-bottom: 30px; border-radius: 12px; box-shadow: 0 4px 15px rgba(0,0,0,0.1); }}
h1 {{ text-align: center; color: #1a365d; }}
img {{ display: block; margin: 15px auto; }}
</style>
</head>
<body>
<div class="container">
<h1>📊 MCP Generated Plots Gallery</h1>
<p style="text-align:center;">Total plots: <strong>{len(plot_history)}</strong> (in creation order)</p>
{plots_html}
</div>
</body>
</html>"""
return HTMLResponse(content=html_content)
except Exception as e:
error_html = f"""<!DOCTYPE html>
<html><body><h1>Error loading gallery</h1><p>{str(e)}</p></body></html>"""
return HTMLResponse(content=error_html)
active_port = 5016
# ── Server Startup ─────────────────────────────────────────────────────
if __name__ == "__main__":
middleware = [
Middleware(
CORSMiddleware,
allow_origins=["*"],
allow_credentials=True,
allow_methods=["*"],
allow_headers=["*"],
)
]
app = mcp.http_app(
path="/mcp",
middleware=middleware,
stateless_http=True, # ← This fixes the session ID error
# transport="http" # Optional: force plain HTTP transport
)
print("🚀 MCP Matplotlib Server started!")
print("→ plots saved to: ./plots/")
print(f"→ MCP Endpoint: http://localhost:{active_port}/mcp")
print(f"→ Gallery: http://localhost:{active_port}/mcp/plots")
print(f"→ Info Page: http://localhost:{active_port}/mcp/html")
uvicorn.run(
app,
host="0.0.0.0",
port=active_port,
log_level="info"
)Once that is done we will look at dockerizing it.. so requirements.txt will become:
fastapi
uvicorn[standard]
starlette
fastmcp
matplotlib
numpy
pandas
scipy
seaborn
scikit-learn
statsmodels
plotly
kaleido
sympy
pillow
python-multipart
And a nice Dockerfile to build an image would then naturally become:
# =============================================================================
# MCP Matplotlib Server - Docker Image
# =============================================================================
FROM python:3.11-slim

WORKDIR /app

# System dependencies for matplotlib + plotly
RUN apt-get update && apt-get install -y --no-install-recommends \
    build-essential \
    libglib2.0-0 libsm6 libxext6 libxrender-dev libfontconfig1 \
    && rm -rf /var/lib/apt/lists/*

COPY requirements.txt .
RUN pip install --no-cache-dir -r requirements.txt

# Ensure plots directory exists
RUN mkdir -p /app/plots

# Copy application
COPY app.py .

EXPOSE 5016

ENV PYTHONUNBUFFERED=1 \
    MPLBACKEND=Agg

# Health check
HEALTHCHECK CMD curl --fail http://localhost:5016/mcp/html || exit 1

# Explicitly run app.py
CMD ["python", "app.py"]
You would be able to stand it up with:
docker build . -t mcp_matplot --no-cache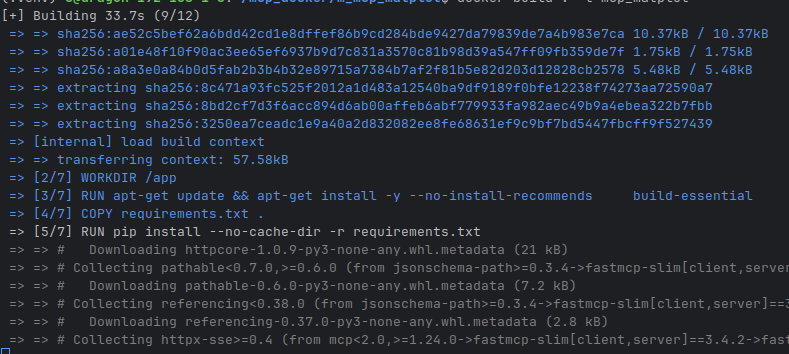
This is going to make a pretty large image! Ah! My bloat! No it's all good,
To run it typically - just use the bash snippet at the top of this!