VPS Monitor. Build a Small CPU / Disk / Ram / Network Monitor
VPS Monitor. Build a Small CPU / Disk / Ram / Network Monitor

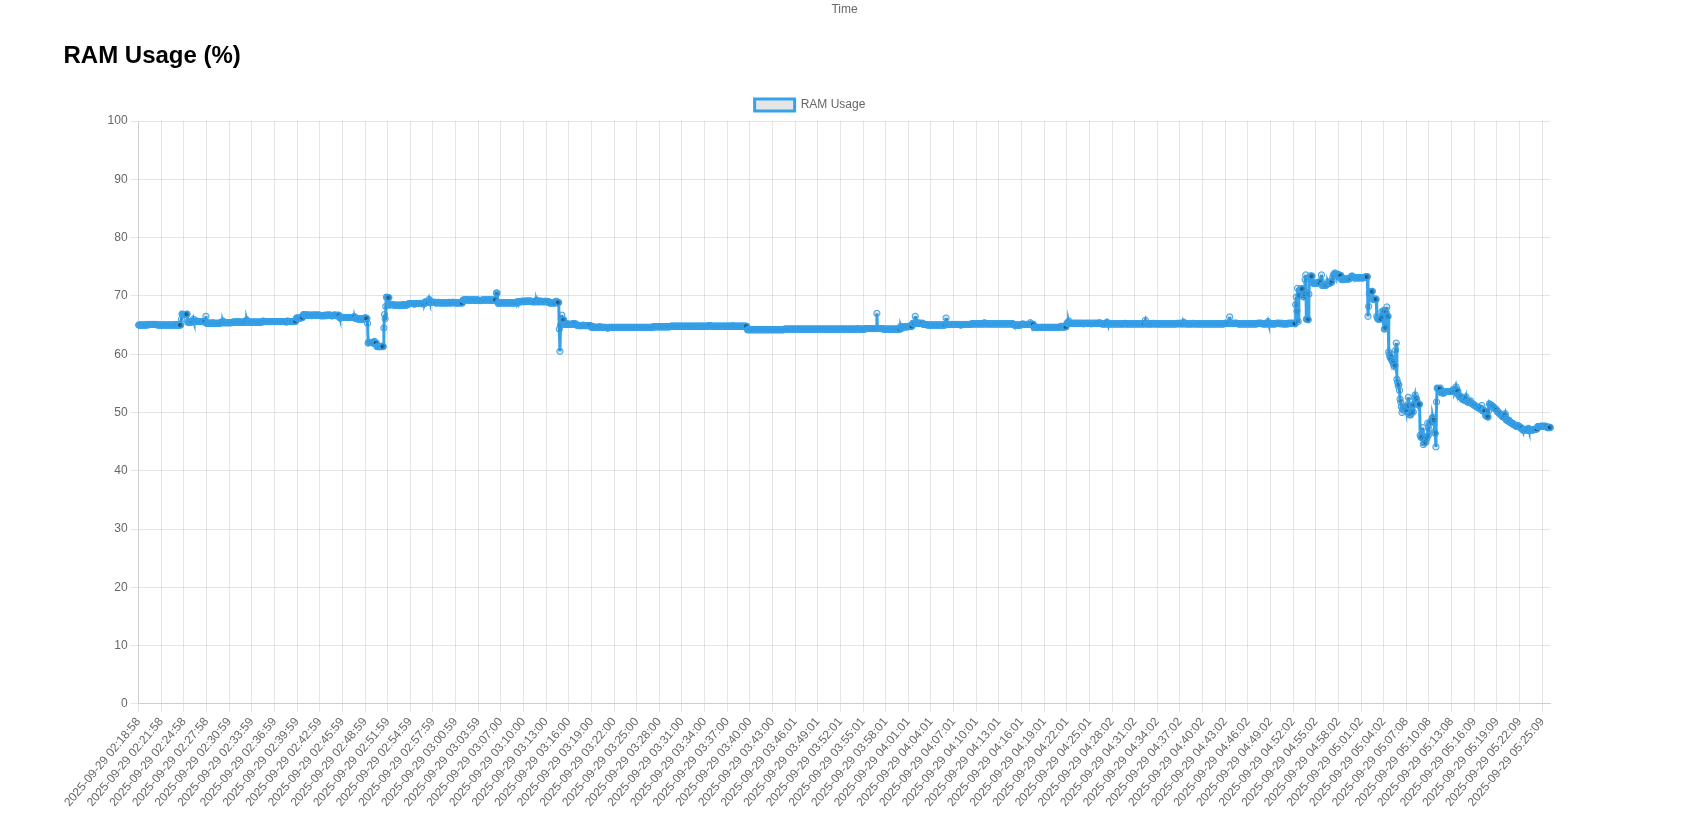
It makes very nice and very clean graphs. We can see our RAM Usage here:
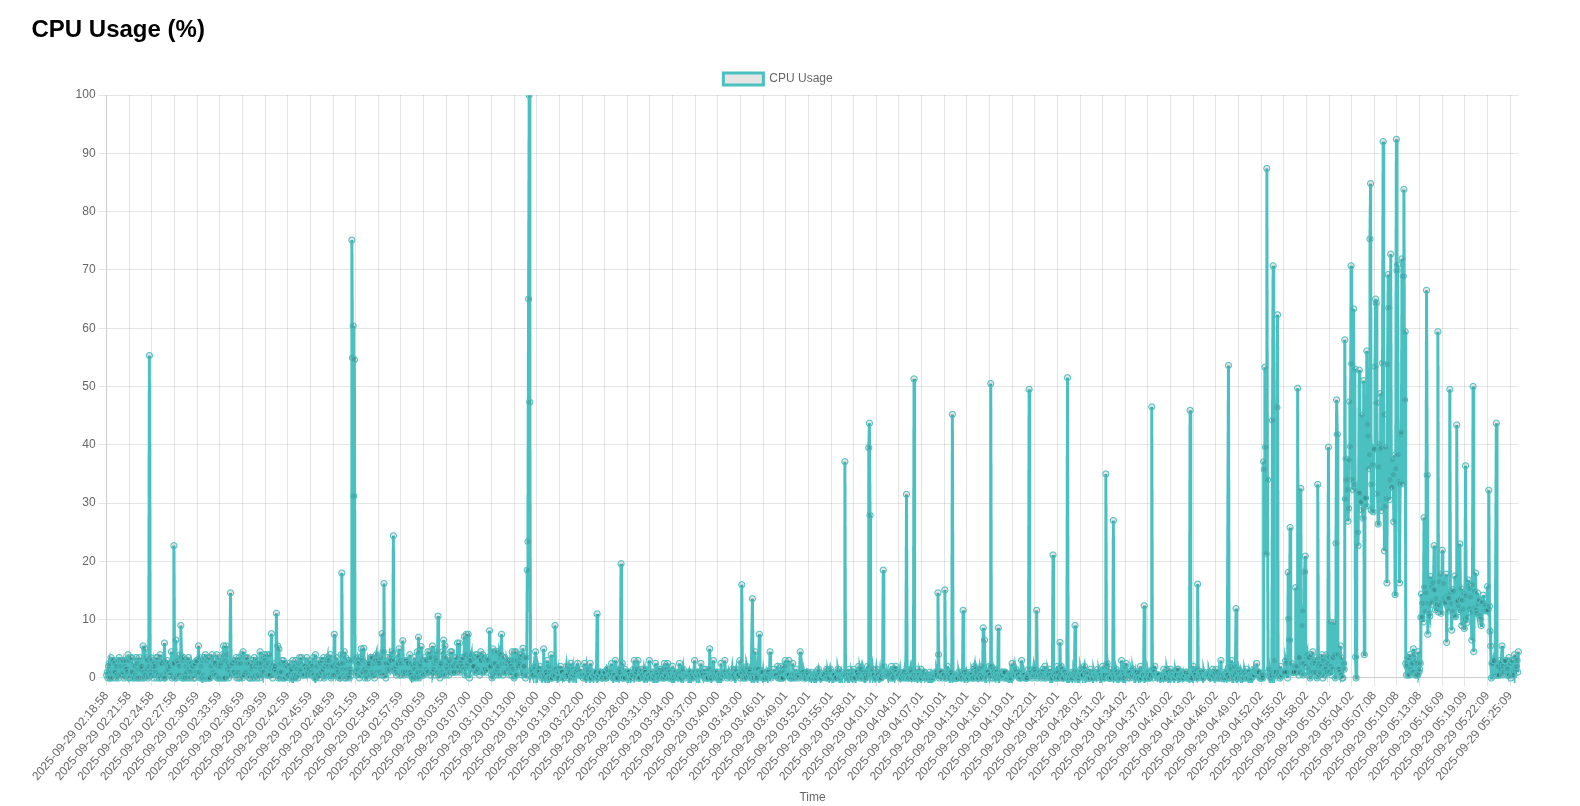
Why It’s Good to Exercise your Docker Containers (At Least Once a Day)..
This is the visual output of a number of containers. Each one was stopped and backed up then restarted. As it ran you can see the CPU RAM requirement significantly dropped!A simple script as written by Grok 4 Expert can do this automatically daily. #!/bin/bash # Ensure script is
 thinkmeltprotonmail.com
If you need a quick review on installing docker:
bash: script: docker installation
In this quick guide we go over installation of docker in the Ubuntu type environment:
thinkmeltprotonmail.com
Make a directory /youdir and inside it make a Dockerfile,
FROM python:3.12-slim

# Set working directory
WORKDIR /app

# Copy the application code
COPY monitor.py .

# Install required Python packages
RUN pip install --no-cache-dir psutil flask

# Expose the port the app runs on
EXPOSE 5000

# Command to run the application
CMD ["python", "monitor.py"]
Inside the monitory.py file put:
import psutil
import time
import threading
import os
import json
from flask import Flask, send_file, jsonify
from datetime import datetime

# Log file
LOG_FILE = 'active.log'
HTML_FILE = 'index.html'


# Function to monitor system metrics every 5 seconds
def monitor_metrics():
    prev_net = psutil.net_io_counters()
    prev_time = time.time()
    while True:
        # Get current timestamp
        timestamp = datetime.now().strftime('%Y-%m-%d %H:%M:%S')

        # CPU usage (over 1 second interval for accuracy)
        cpu = psutil.cpu_percent(interval=1)

        # RAM usage
        ram = psutil.virtual_memory().percent

        # Disk usage (root partition)
        disk = psutil.disk_usage('/').percent

        # Network traffic
        current_net = psutil.net_io_counters()
        curr_time = time.time()
        interval = curr_time - prev_time
        if interval > 0:
            sent = (current_net.bytes_sent - prev_net.bytes_sent) / interval / 1024  # KB/s
            recv = (current_net.bytes_recv - prev_net.bytes_recv) / interval / 1024  # KB/s
        else:
            sent = 0
            recv = 0
        prev_net = current_net
        prev_time = curr_time

        # Append to log
        with open(LOG_FILE, 'a') as f:
            f.write(f"{timestamp} {cpu} {ram} {disk} {sent} {recv}\n")

        # Sleep for 5 seconds (minus the 1 second for cpu_percent)
        time.sleep(4)


# Function to read log and return data as dict
def get_log_data():
    times = []
    cpus = []
    rams = []
    disks = []
    sents = []
    recvs = []

    if os.path.exists(LOG_FILE):
        with open(LOG_FILE, 'r') as f:
            for line in f:
                parts = line.strip().split()
                if len(parts) == 7:
                    times.append(parts[0] + ' ' + parts[1])
                    cpus.append(float(parts[2]))
                    rams.append(float(parts[3]))
                    disks.append(float(parts[4]))
                    sents.append(float(parts[5]))
                    recvs.append(float(parts[6]))

    return {
        'times': times,
        'cpus': cpus,
        'rams': rams,
        'disks': disks,
        'sents': sents,
        'recvs': recvs
    }


# Generate static HTML template (without embedded data)
def generate_html_template():
    html_content = """
    <!DOCTYPE html>
    <html lang="en">
    <head>
        <meta charset="UTF-8">
        <meta name="viewport" content="width=device-width, initial-scale=1.0">
        <title>System Usage Monitor</title>
        <script src="https://cdn.jsdelivr.net/npm/chart.js"></script>
        <style>
            body { font-family: Arial, sans-serif; margin: 20px; }
            .chart-container { width: 80%; margin: 20px auto; }
            h1 { text-align: center; }
            #updateBtn { display: block; margin: 20px auto; padding: 10px 20px; font-size: 16px; }
        </style>
    </head>
    <body>
        <h1>System Usage Over Time</h1>

        <button id="updateBtn">Update</button>

        <div class="chart-container">
            <h2>CPU Usage (%)</h2>
            <canvas id="cpuChart"></canvas>
        </div>

        <div class="chart-container">
            <h2>RAM Usage (%)</h2>
            <canvas id="ramChart"></canvas>
        </div>

        <div class="chart-container">
            <h2>Disk Usage (%)</h2>
            <canvas id="diskChart"></canvas>
        </div>

        <div class="chart-container">
            <h2>Network Traffic (KB/s)</h2>
            <canvas id="netChart"></canvas>
        </div>

        <script>
            let cpuChart, ramChart, diskChart, netChart;

            function createOrUpdateChart(ctx, label, data, color, times) {
                if (!ctx.chart) {
                    ctx.chart = new Chart(ctx, {
                        type: 'line',
                        data: {
                            labels: times,
                            datasets: [{
                                label: label,
                                data: data,
                                borderColor: color,
                                fill: false
                            }]
                        },
                        options: {
                            responsive: true,
                            scales: {
                                y: { beginAtZero: true, max: 100 },
                                x: { title: { display: true, text: 'Time' } }
                            }
                        }
                    });
                } else {
                    ctx.chart.data.labels = times;
                    ctx.chart.data.datasets[0].data = data;
                    ctx.chart.update();
                }
            }

            function createOrUpdateNetChart(ctx, times, sents, recvs) {
                if (!ctx.chart) {
                    ctx.chart = new Chart(ctx, {
                        type: 'line',
                        data: {
                            labels: times,
                            datasets: [
                                { label: 'Upload', data: sents, borderColor: 'rgb(255, 99, 132)', fill: false },
                                { label: 'Download', data: recvs, borderColor: 'rgb(153, 102, 255)', fill: false }
                            ]
                        },
                        options: {
                            responsive: true,
                            scales: {
                                y: { beginAtZero: true },
                                x: { title: { display: true, text: 'Time' } }
                            }
                        }
                    });
                } else {
                    ctx.chart.data.labels = times;
                    ctx.chart.data.datasets[0].data = sents;
                    ctx.chart.data.datasets[1].data = recvs;
                    ctx.chart.update();
                }
            }

            function fetchAndUpdateData() {
                fetch('/data')
                    .then(response => response.json())
                    .then(data => {
                        const times = data.times;
                        createOrUpdateChart(document.getElementById('cpuChart').getContext('2d'), 'CPU Usage', data.cpus, 'rgb(75, 192, 192)', times);
                        createOrUpdateChart(document.getElementById('ramChart').getContext('2d'), 'RAM Usage', data.rams, 'rgb(54, 162, 235)', times);
                        createOrUpdateChart(document.getElementById('diskChart').getContext('2d'), 'Disk Usage', data.disks, 'rgb(255, 206, 86)', times);
                        createOrUpdateNetChart(document.getElementById('netChart').getContext('2d'), times, data.sents, data.recvs);
                    })
                    .catch(error => console.error('Error fetching data:', error));
            }

            // Initial fetch
            fetchAndUpdateData();

            // Update button
            document.getElementById('updateBtn').addEventListener('click', fetchAndUpdateData);
        </script>
    </body>
    </html>
    """

    # Write to HTML file
    with open(HTML_FILE, 'w') as f:
        f.write(html_content)


# Flask app
app = Flask(__name__)


@app.route('/')
def home():
    if not os.path.exists(HTML_FILE):
        generate_html_template()
    return send_file(HTML_FILE)


@app.route('/data')
def data():
    return jsonify(get_log_data())


if __name__ == '__main__':
    # Generate initial HTML template
    generate_html_template()

    # Start monitoring thread
    monitor_thread = threading.Thread(target=monitor_metrics, daemon=True)
    monitor_thread.start()

    # Run Flask app
    app.run(host='0.0.0.0', port=5000)
It can be easily built with two docker commands:
docker build --tag 'traffic_monitor' .
docker run --name traffic_monitor -d -p 5000:5000 --detach traffic_monitor
It should be noted that:
- -d daemon mode.
- -p 5000:5000 means map open all port 5000 to the internal port 5000 in the container.
- --detach leave running in the background of the image 'traffic_monitor'